跳转到该页面的主要内容

城市概况

Please enable JavaScript to use the website of the Tokyo Metropolitan Government.

资料

统计资料

图1 日本与东京的各种统计

Area(2010)
Population(2010)
Gross Regional Product(FY2013)
Financial Scale(FY2013 Initial General Account Budget)
Number of Business Establishments(2014)
Number of Employed Persons(2010)
Annual Commercial Sales(2014)
Number of Corporations Capitalized at Over 1 Billion Yen(2014)

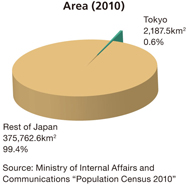
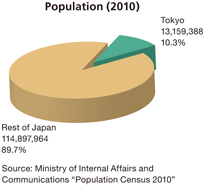
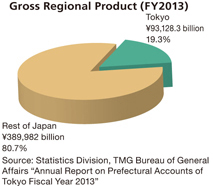
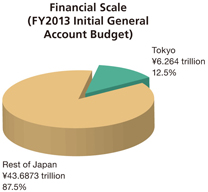
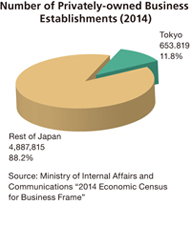
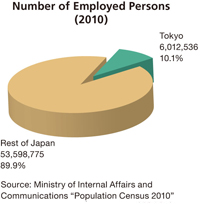
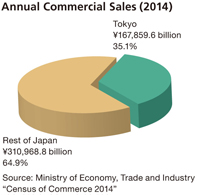
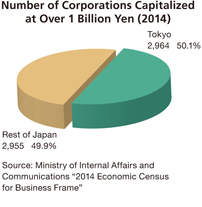
图2 世界各主要国家与东京都GDP的比较(2013年)

图2 世界各主要国家与东京都GDP的比较(2013年
注1:
数据为2013年(历年)的比较。但是,东京都为2013年度(4/1~3/31),澳大利亚为2013年度(7/1~6/30)。
注2:
东京都GDP使用东京外汇市场银行同业间折借即期汇率月平均值的12个月平均值(1美元=100.23日元)换算。
出处:
总务局统计部《都民经济计算年报 2013年度》
内阁府《2013年度 国民经济计算年报》

图3 东京都男女人口年龄分布的推移

东京都男女人口年龄分布变化图(1970)
东京都男女人口年龄分布变化图(2010)
出处:
总务省《国势调查》