Please enable JavaScript to use the website of the Tokyo Metropolitan Government.
APPENDICES
Statistics
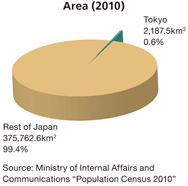
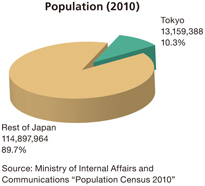
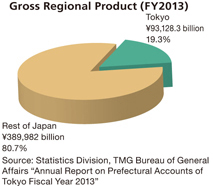
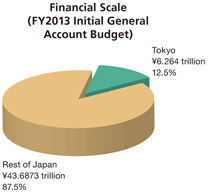
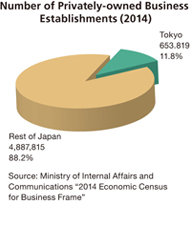
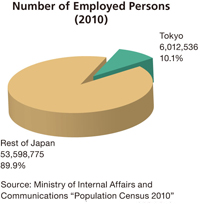
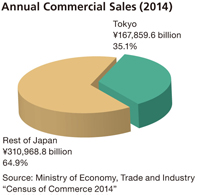
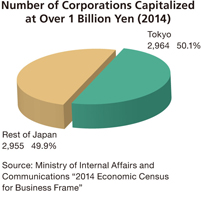
Fig. 1 Tokyo Compared to the Rest of Japan
Fig. 2 Tokyo’s gross prefectural domestic product compared to the gross domestic product of major countries (2013)
- Note1:
- Data for calendar year 2013, except for Tokyo (FY2013 (April-March)) and Australia (FY2013 (July-June)).
- Note2:
- Tokyo's gross prefectural domestic product converted at 100.23 yen per US dollar, the average of 12 monthly averages of interbank spot rates in Tokyo.
- Sources:
- Statistic Division, TMG Bureau of General Affairs " Annual Report on Prefectural Accounts of Tokyo Fiscal year 2013", Cabinet Office "Annual Report on National Accounts for 2013"
Fig. 3 Change in Population Age Structure by Gender for Tokyo (1970, 2010)
- Sources:
- Ministry of Internal Affairs and Communications “Population Census”